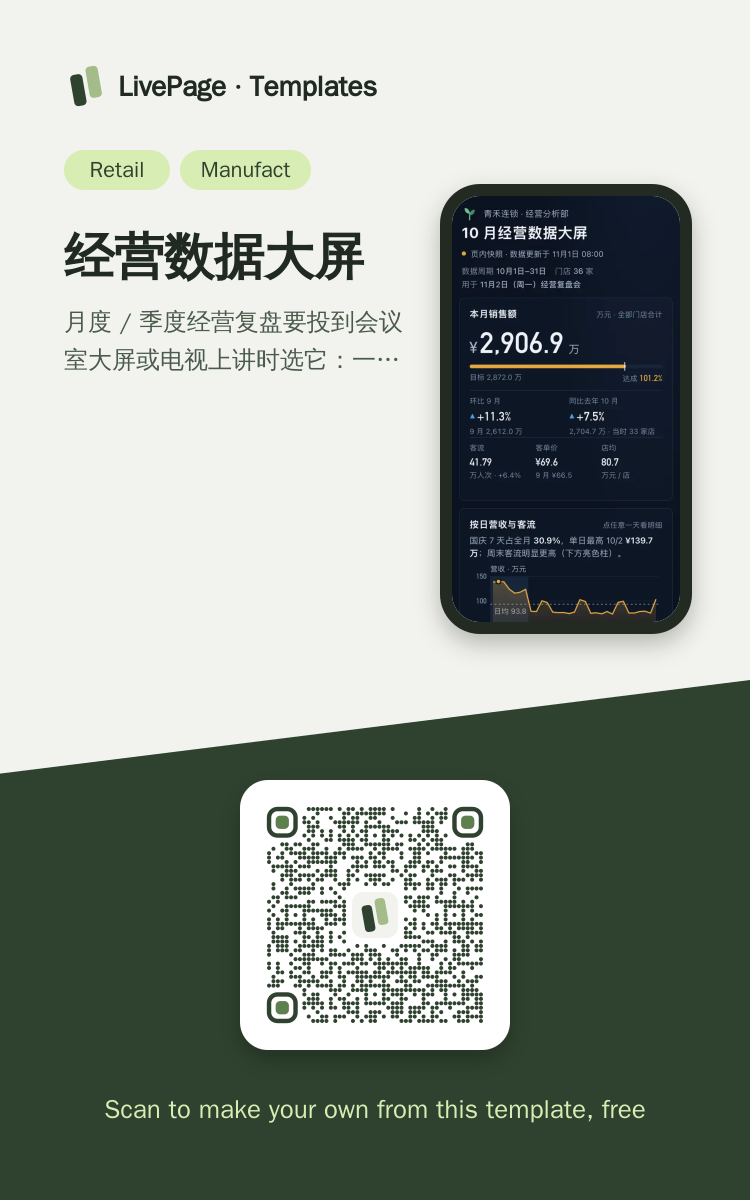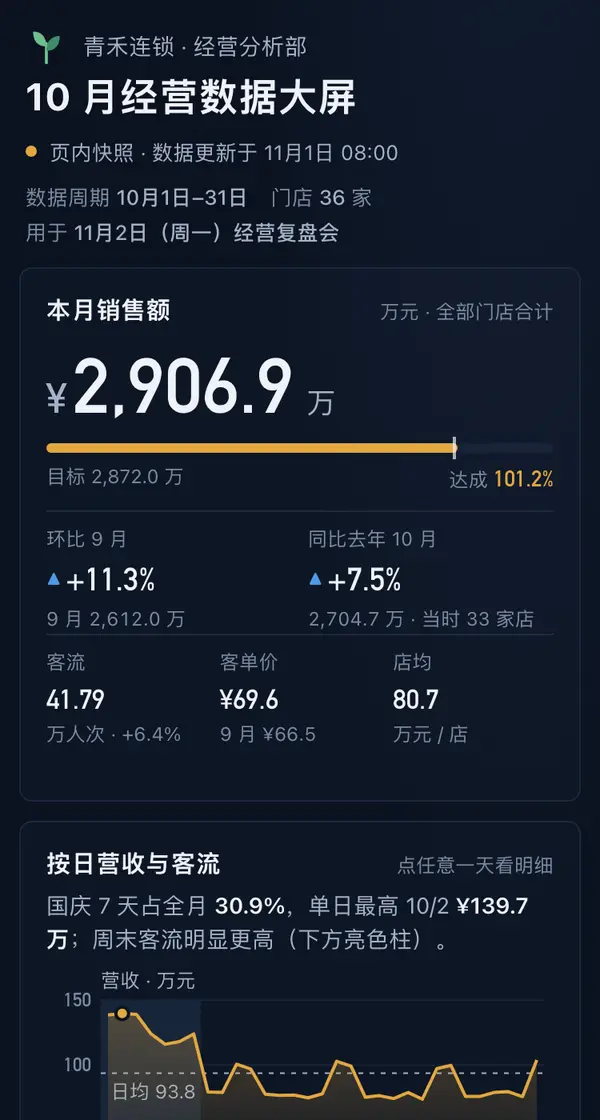
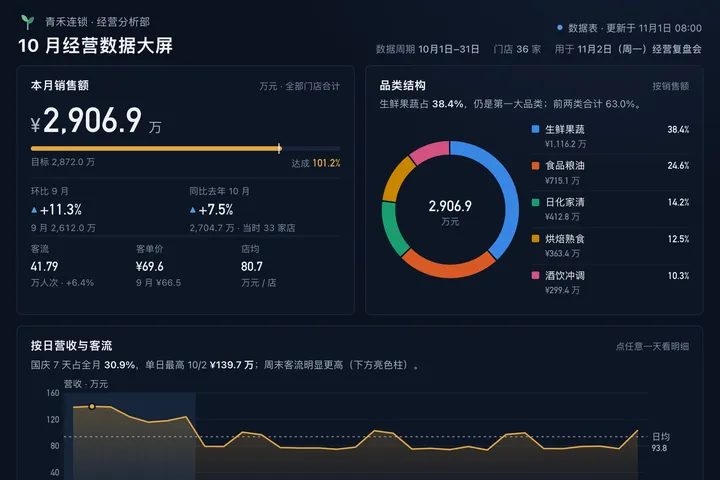
One link opens on phones, computers and big screens, and adapts to each.
经营数据大屏 template
Example: 青禾连锁 · 10 月经营数据大屏 · 数据大屏
帮我把这个月的经营数据做成一块投到会议室大屏上讲的数据大屏网页:深色、克制的科技感,电脑上 1440 宽一屏装下,用网格排开——左上是本月销售额的大读数(数字滚动出来),下面一条对目标的达成进度、环比和同比,再加客流、客单价、店均三个小数;中间是按日营收与客流(上下两块共用一条日期轴,节假日打底色,标日均线,点任意一天看明细);右上是品类结构环形图;下面一排是片区达成率(用 SVG 画一张抽象的片区分块地图,颜色深浅表示达成率,圆点是门店、低于 90% 的标红,点片区看门店明细)、门店销售额 TOP10(自动依次高亮一轮)、会员增长漏斗(每一步标转化率);最底下一条异常预警滚动条。进入时各块依次点亮,之后只有预警条在滚动。所有数字放在一张数据表里(每行一种:门店、每日、品类、漏斗、对比数、预警),页面读这张表算合计,改表不用重发;手机上改成竖排卡片,图单独画一套。

Reference template: first read https://space.24haowan.com/examples/sample-ops-screen/agent.md and follow its structure and layout, replacing all content with mine. Deliver one self-contained HTML file (styles inline, no external files, good on phones) and give me the .html file to download.
· If you have LivePage tools (MCP): use sample sample-ops-screen as the base (list_examples key=sample-ops-screen), publish it on LivePage and show me the preview first.
· No LivePage tools but you can send HTTPS requests: POST the finished HTML with Content-Type: text/html to https://space.24haowan.com/api/quick?client=template-sample-ops-screen and give me the preview link and claim link it returns (a 7-day temporary link).
If you don't have the LivePage connector (MCP) yet, read https://space.24haowan.com/for-agents.md first and follow it to connect, or publish without signing in.
Doubao, DeepSeek, Kimi, Yuanbao, ChatGPT, Claude… any agent that can read a link
Publish as a link that opens in WeChat
WorkBuddy, Claude, Codex and other MCP agents; sign in by scanning with WeChat
Connecting LivePage in WorkBuddy for the first time? See the illustrated guide ›
Connect me to LivePage: first read https://space.24haowan.com/for-agents.md and walk me through it step by step; then use https://space.24haowan.com/examples/sample-ops-screen/agent.md as a reference to make my own "青禾连锁 · 10 月经营数据大屏", publish it on LivePage and show me the preview first.

My requirements: 帮我把这个月的经营数据做成一块投到会议室大屏上讲的数据大屏网页:深色、克制的科技感,电脑上 1440 宽一屏装下,用网格排开——左上是本月销售额的大读数(数字滚动出来),下面一条对目标的达成进度、环比和同比,再加客流、客单价、店均三个小数;中间是按日营收与客流(上下两块共用一条日期轴,节假日打底色,标日均线,点任意一天看明细);右上是品类结构环形图;下面一排是片区达成率(用 SVG 画一张抽象的片区分块地图,颜色深浅表示达成率,圆点是门店、低于 90% 的标红,点片区看门店明细)、门店销售额 TOP10(自动依次高亮一轮)、会员增长漏斗(每一步标转化率);最底下一条异常预警滚动条。进入时各块依次点亮,之后只有预警条在滚动。所有数字放在一张数据表里(每行一种:门店、每日、品类、漏斗、对比数、预警),页面读这张表算合计,改表不用重发;手机上改成竖排卡片,图单独画一套。
Share poster
In WeChat, long-press the image to save or forward it. Scanning the code opens this template.
About this template
月度 / 季度经营复盘要投到会议室大屏或电视上讲时选它:一屏装下销售额、按日走势、片区达成、品类结构、门店排行、会员转化和异常预警,数字放在一张数据表里,改表不用重发、链接不变;手机上自动改成竖排卡片,会后发到群里照样能看。一天里数字一直在变、群里随时点开看实时进度的销售战报选 sample-sales-live;要逐条交办、回收处置进度的监测日报选 sample-monitor-daily;写成文字结论为主的周报选 sample-weekly-report。
Page structure:本月销售额 · 按日营收与客流 · 品类结构 · 片区达成率 · 门店 TOP10 · 会员增长 · 异常预警
- 页面读数据表(fetch ./_data/metrics.json)渲染:改表不用重发页面、链接不变;读不到表时停在页内快照并标明
- 大屏一屏布局(1440 宽及以上一屏装下)+ 手机竖排卡片版,同一份数据
- 图表可点:点任意一天看营收 / 客流 / 客单价,点片区看门店明细
- 阅读回执(谁看了 / 看到哪一节)
Prepare before publishing: 数据表 metrics(列 kind / key / label / value / value2 / note;kind 是 meta 月份与更新时刻、kpi 对比数、region 片区、store 门店、day 每日、cat 品类、funnel 漏斗、alert 预警;append_open 不用开):发之前用 set_data 建好,之后每月只改这张表、不用重发页面
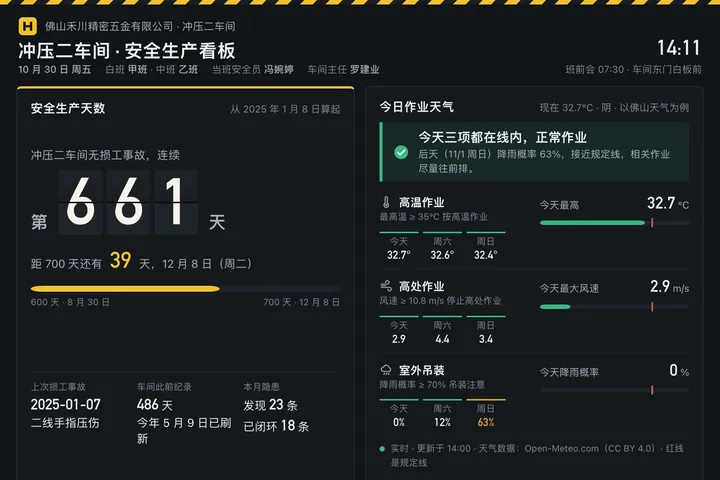
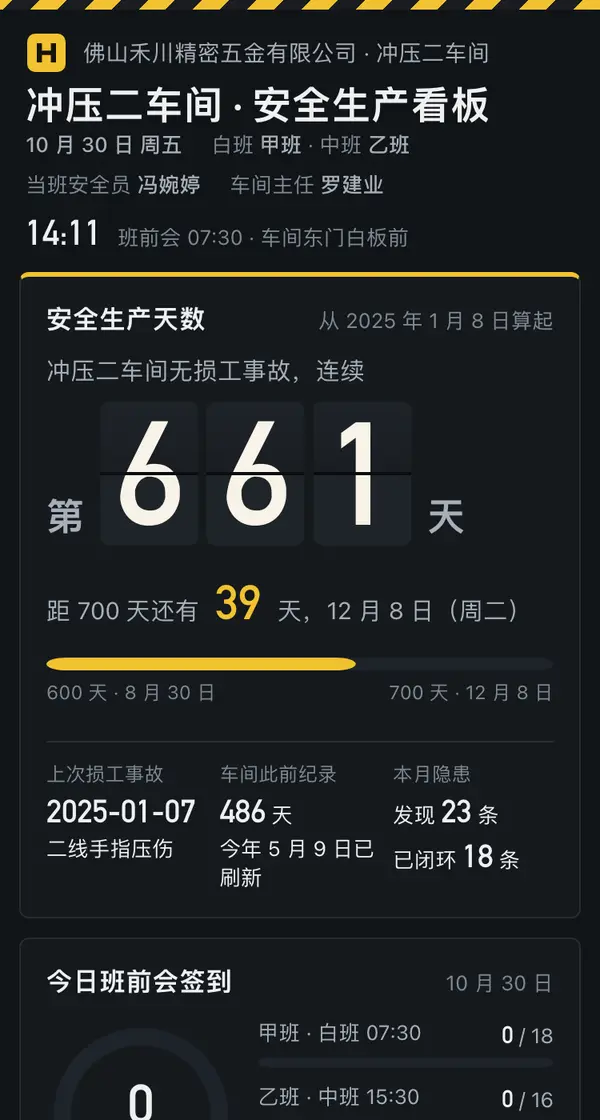 Big screen
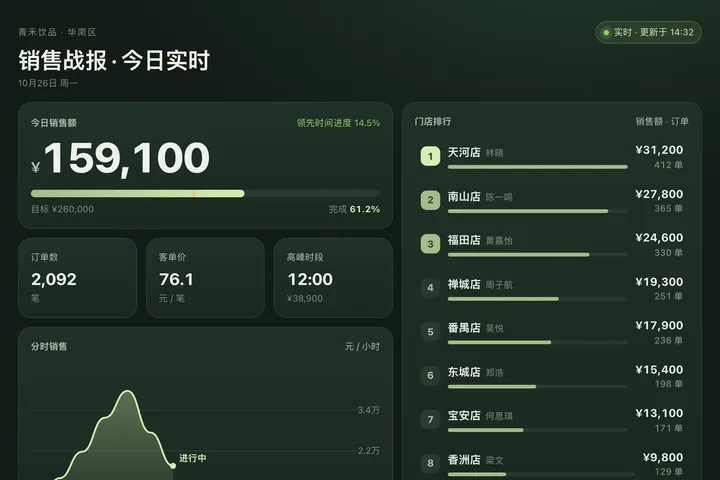
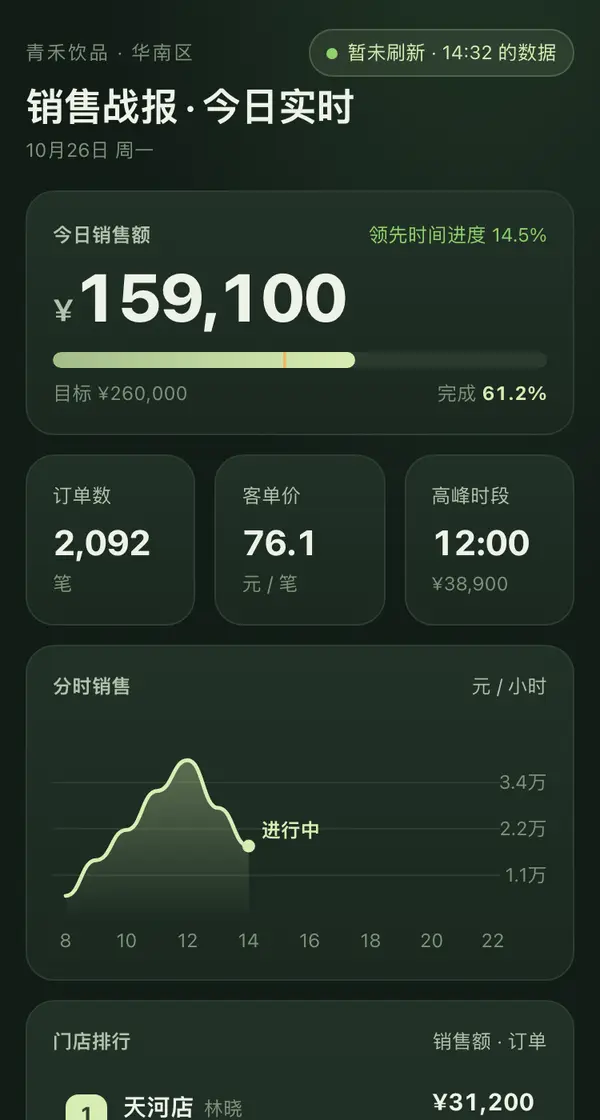 Big screen
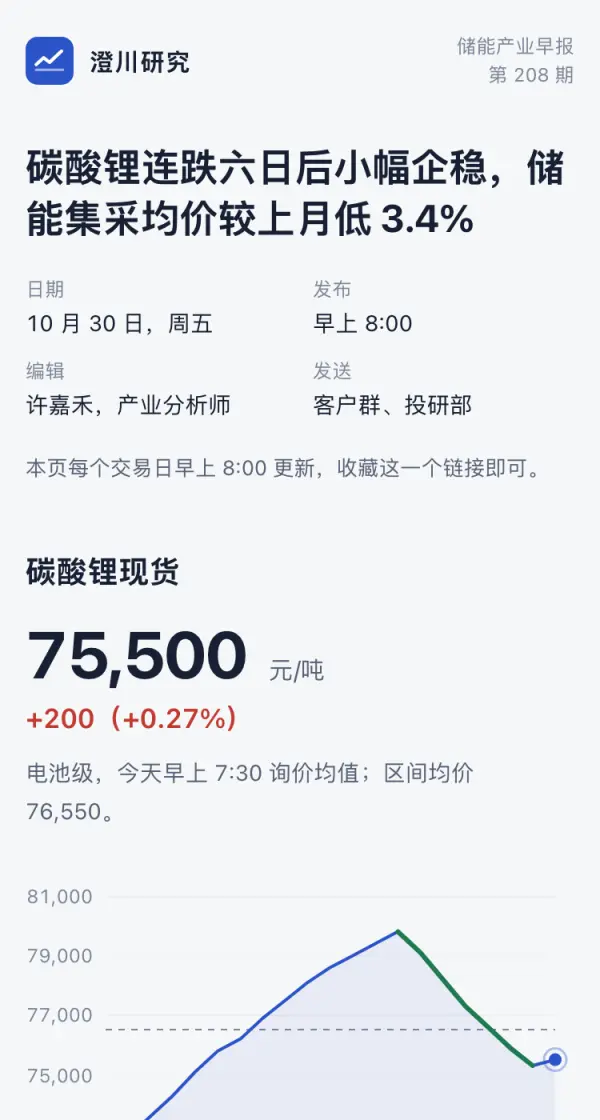
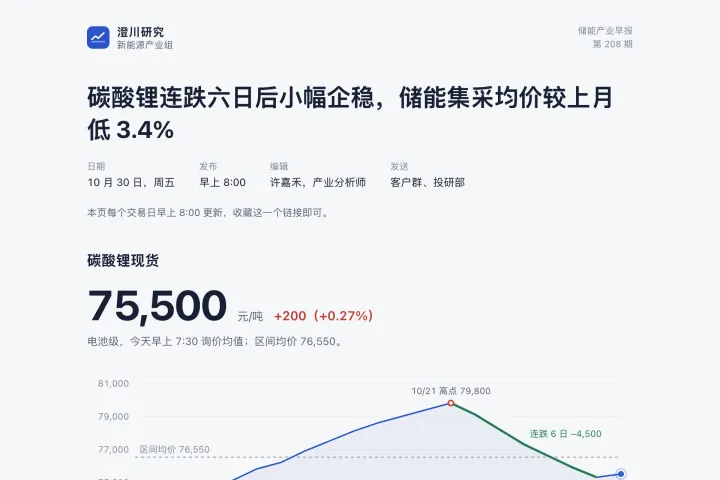 Phone · Desktop
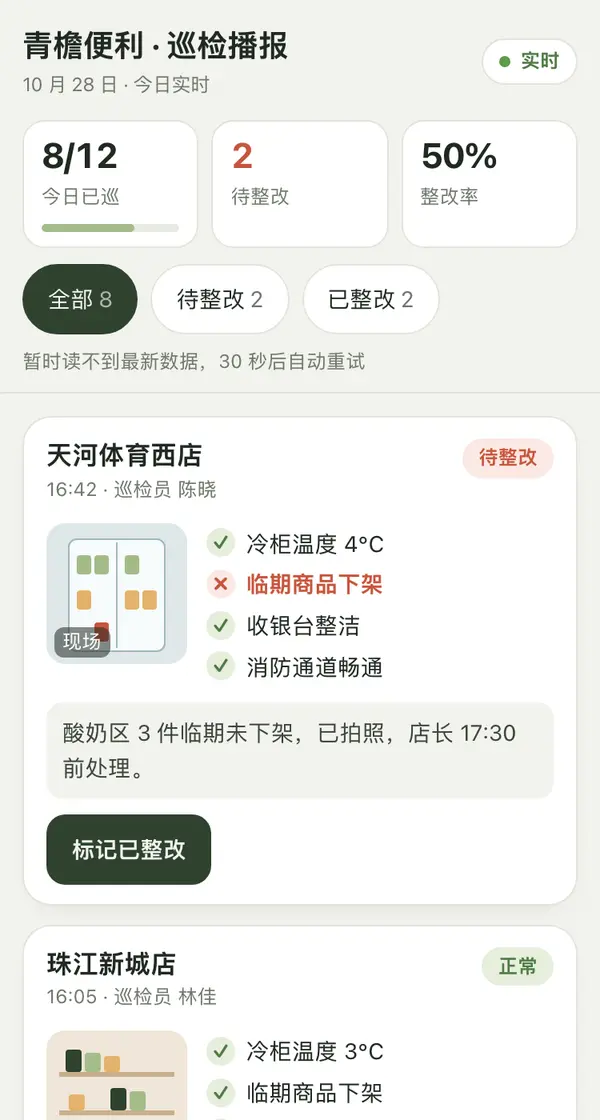
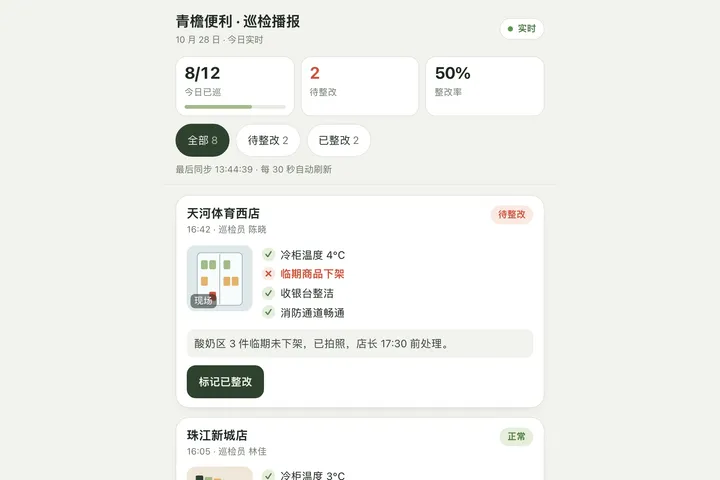 Mobile

 Mobile
 Mobile